Can we trust self-scores? Our search for an honest measure of leadership growth
Over the years we have tried surveys, follow-up studies, monthly self-assessments and task records to see whether young leaders grow. Each one taught us something, and each one leaned on people rating themselves. This is the story of that search and where it is heading.
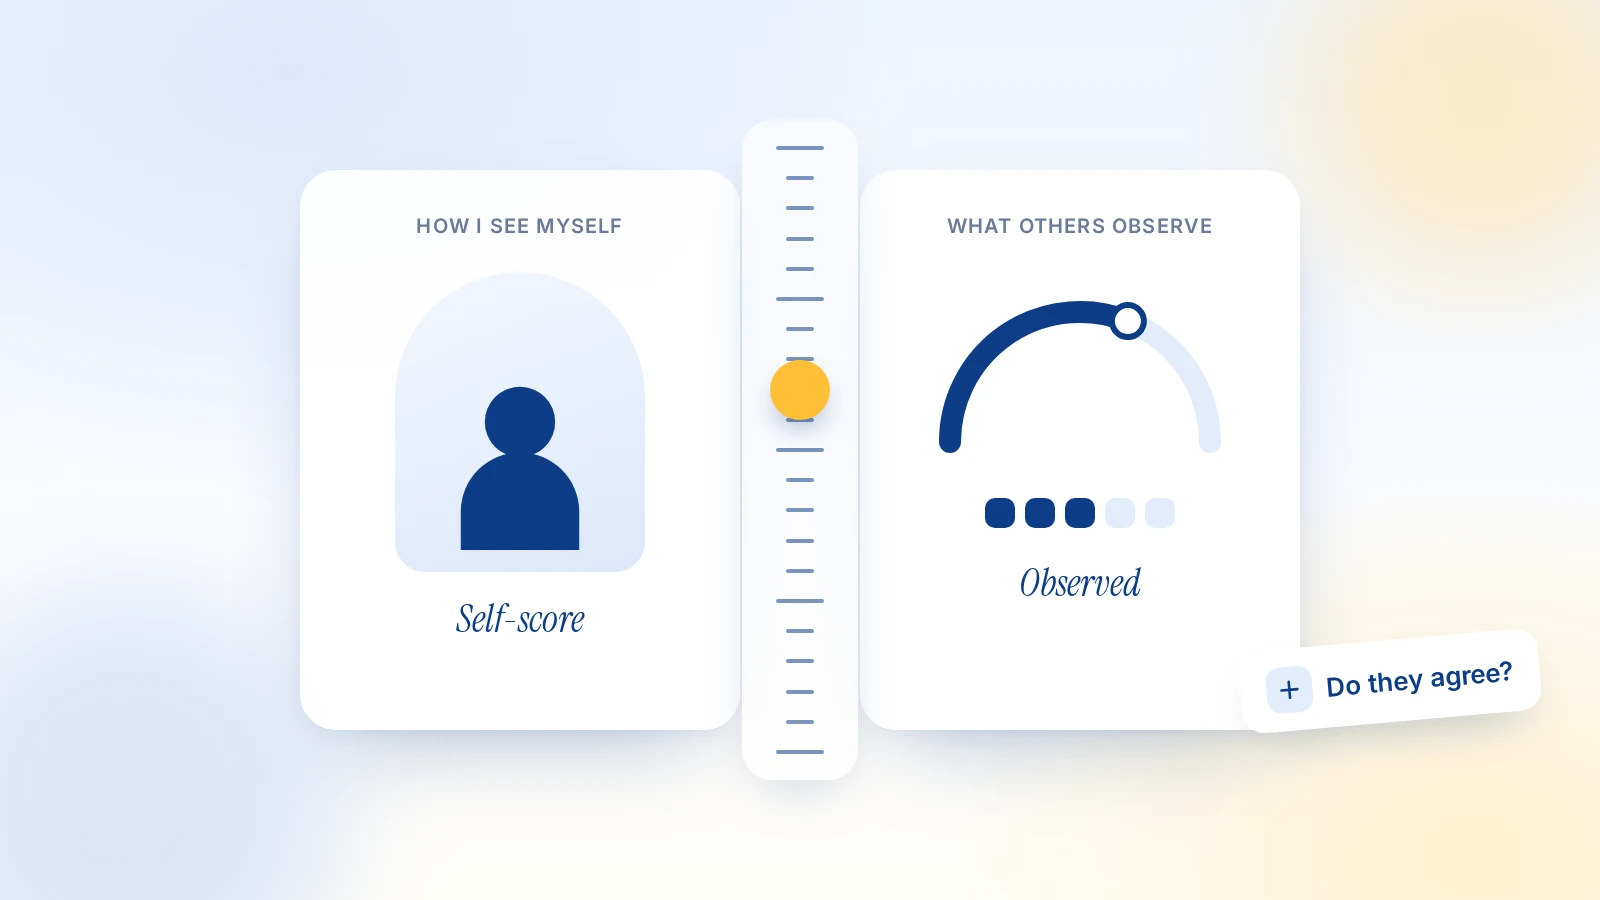
Every programme that says it develops leaders is eventually asked to prove it. Leadership shows up slowly, in choices and habits, and most of it never appears on a certificate. For several years we have been looking for a way to measure that growth that is practical for a small organisation and honest enough to publish. This piece describes what we tried, what each attempt showed and what it could not show. Our companion piece, In pursuit of a way to measure leadership and entrepreneurship development, sets out the results themselves.
Asking graduates at the end
Our first tools were surveys at the end of a programme. In one Leadership Development Training cohort, ten of fourteen graduates responded, a response rate of 71.4%. Eight would recommend the programme to a friend with a score of 10 out of 10 and two with a score of 9. Surveys like this tell us whether people valued the experience. They arrive when the programme is over and they measure satisfaction more than change.
Asking graduates to look back
Our first Tracer Study returned to graduates after they had left and asked them to rate their leadership before and after training on a scale of 1 to 5. On average, respondents reported a gain of about 1.28 points, reaching 4.43 after training, and 84.6% said they are still connected to our community. Both ratings were given at the same moment, after the training, so the “before” score is a memory. People who feel they have grown tend to remember starting lower, which can make gains look larger than they were. The number of respondents was not recorded with the findings and the response rate was described as low.
Measuring every month
To see growth while it happens, we built LeaderMeter for our Leadership Experience Programme. Each month leaders score themselves from 1 to 5 on seven indicators: initiative, commitment, problem solving, learnings, keeping their word, adaptability, and measuring their own successes and failures. Each score comes with a short written reflection on what the leader did that month. Between October 2024 and May 2026 leaders filed 100 reports.
The scores do move. In the current programme year the average overall LeaderMeter score was 2.50 in January 2026 and 3.63 across April and May, when only eight reports were filed between them. The bigger lesson was about who reports. The 24 leaders currently active in the programme filed 62 of the 360 monthly reports expected of them, about 17%. Of those 24 leaders, 19 had filed at least one report and 5 had never submitted. Only 5 had filed a report in May or June 2026; the other 14 had lapsed. Leaders who later lapsed had scored a little lower while they were reporting (an average of 2.48 across 36 reports) than those still active (2.67 across 64). A monthly average therefore describes the leaders who keep reporting more than the whole programme.
Looking for behaviour
Self-scores need a check from outside the leader’s own view, so we added task records: the compulsory programme tasks each leader completes, with a quality rating. In June 2026 the task dashboard covered 25 active leaders and showed an average completion of 6%, with no quality ratings entered. We read that mainly as a record that was not kept up, which means it cannot yet tell us how leaders behave. The written monthly reflections are richer, but they are not scored, and we do not publish them.
What the research literature warns
We are not alone in this difficulty. Reviewing ways to measure personal qualities such as self-control and grit, Duckworth and Yeager (2015) compared self-report questionnaires, reports by teachers and performance tasks, and concluded that each approach is imperfect in its own way. They urged caution about using any of them for high-stakes judgements. In leadership research, a systematic review of 285 articles on servant leadership found 16 different measures in use, of uneven rigour (Eva and colleagues, 2019). Choosing a measure is itself a research decision.
Where we are heading
We have concluded that no single measure will do. Our plan is to combine measures that check one another:
- monthly self-scores, read alongside reporting rates so readers can see who is counted;
- ratings by mentors or peers for the same indicators, so self-view can be compared with how others see a leader;
- task records that are kept up every month;
- one validated external leadership scale, chosen from those the research literature has tested, given at entry and exit;
- our second Tracer Study, designed in March 2026, with about 48 questions in six sections, including a baseline for each growth area, occupation, jobs created and the people graduates reach.
What this evidence can and cannot show
Everything we have measured so far relies mainly on young people rating themselves. Our samples are small, reporting is uneven, the people who keep reporting are likely to be the most engaged, and none of our measures yet includes a comparison group. The Tracer Study 2.0 questionnaire has no responses yet. We will publish the response rate with every result, and we will say when a number is too thin to carry weight.
Sources
- Duckworth, A. L. and Yeager, D. S. (2015). Measurement matters: assessing personal qualities other than cognitive ability for educational purposes. Educational Researcher 44 (4), 237 to 251. doi.org/10.3102/0013189X15584327 (we read the published abstract)
- Eva, N., Robin, M., Sendjaya, S., van Dierendonck, D. and Liden, R. C. (2019). Servant leadership: a systematic review and call for future research. The Leadership Quarterly 30 (1), 111 to 132. doi.org/10.1016/j.leaqua.2018.07.004
- The GracedLife Leadership Centre. Tracer Study 1.0 findings, presented to our team on 6 June 2026; Tracer Study 2.0 questionnaire, March 2026; TGLC Impact Dashboard, Leadership Development Training cohort survey; LeaderMeter 2.0 Participation sheet and Task Center dashboard, May and June 2026 (internal records; aggregates only).
Press and enquiries
Emmanuel Goodglory
Director, Research, Africa Impact & Global Visibility
The GracedLife Leadership Centre
egoodglory@gracedlifeleaders.org
General enquiries
TGLC Research Desk
research@gracedlifeleaders.org