In pursuit of a way to measure leadership and entrepreneurship development
Leadership is easy to praise and hard to count. Here is how we have tried to measure it over the years, what the numbers show about the young people we serve, and where our methods still fall short.
Every programme that claims to develop leaders faces the same difficulty. Leadership shows up in choices, habits and relationships over years, and most of it never appears on a certificate. Funders, governments and young people themselves deserve better evidence than stories, so we have been building ways to measure growth while it happens.
How our measures have developed
The simplest measures we keep are counts: how many people started a cohort, how many stayed and how many we reached through outreach. Counts tell us about scale and retention. They say nothing about whether anyone grew.
We also run surveys at the end of a programme. In our Leadership Development Training cohort survey, graduates rated how well the training covered our core leadership areas, the quality of their mentorship and whether they would recommend the programme. Ten of fourteen graduates in that cohort responded. Every respondent rated the coverage of our growth areas, which we call the 4Gs, at 4 or 5 out of 5.
The Tracer Study goes back to graduates after they have left. Our first round asked graduates to rate their leadership before and after training and whether they are still connected to us. Respondents reported an average gain of about 1.28 points, reaching 4.43 out of 5, and 84.6% said they are still connected. Our second round, designed in March 2026, has about 48 questions in six sections. It covers growth in each of our leadership areas against a baseline, the projects and Sustainable Development Goals graduates work on, their occupation, the jobs they have created and the people they reach.
LeaderMeter: measuring every month
Surveys at the end of a programme arrive too late to help anyone. So in our Leadership Experience Programme we introduced LeaderMeter, a monthly self-assessment. Each month, leaders score themselves from 1 to 5 on seven indicators: initiative, commitment, problem solving, learning, keeping their word, adaptability, and measuring their own strengths and failures. The scores are combined into a monthly composite.
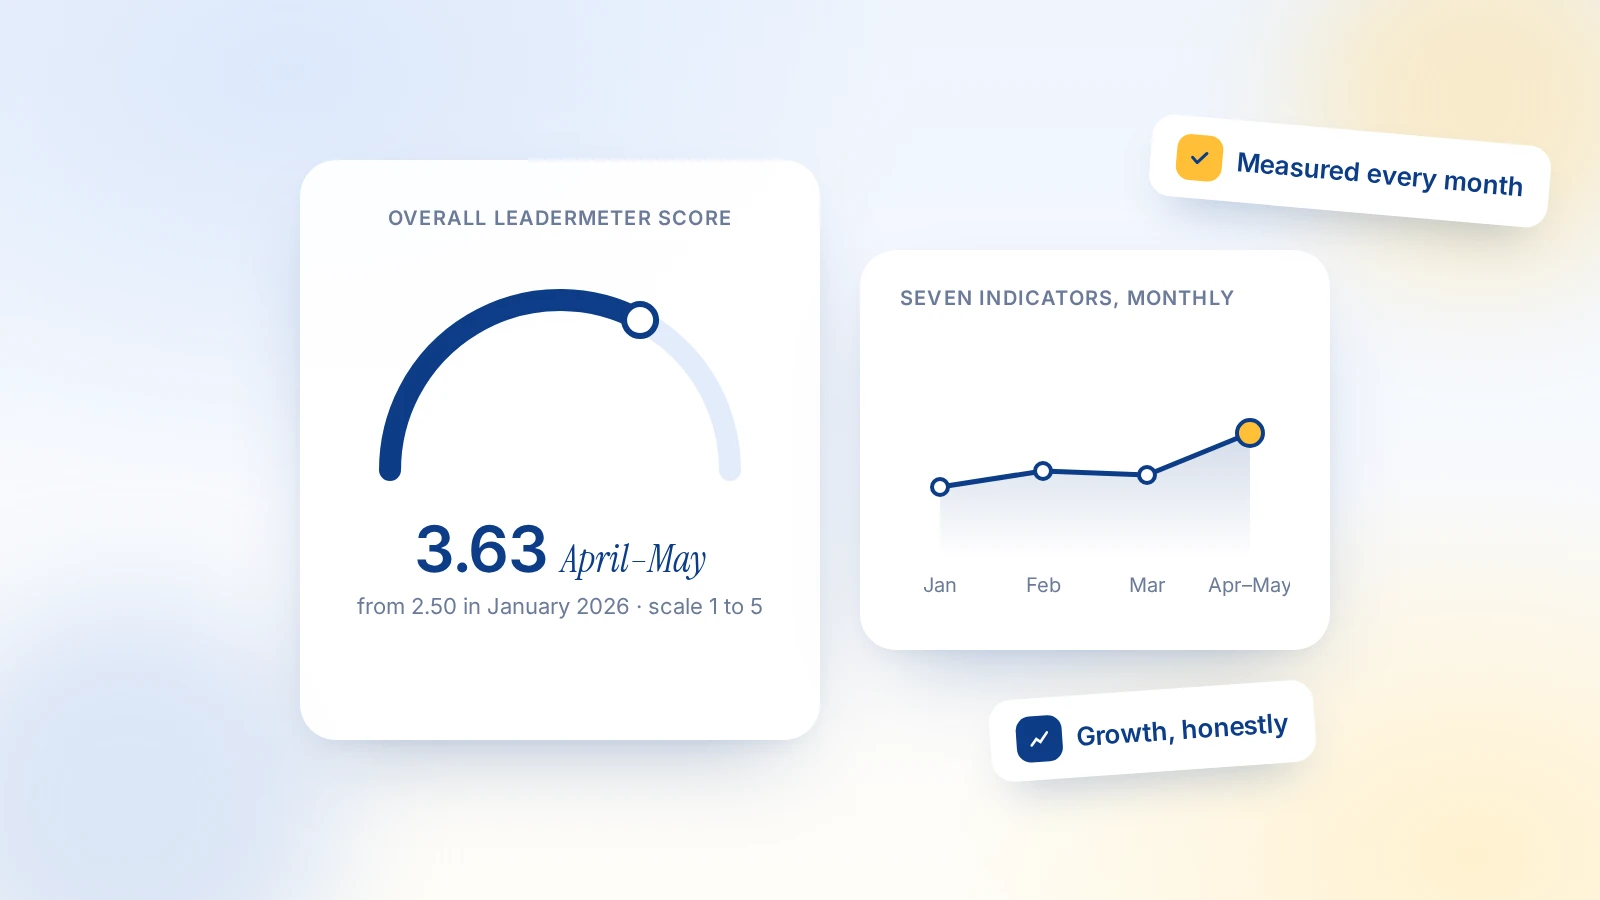
In the current programme year, the average overall LeaderMeter score rose from 2.50 in January 2026 to 3.63 across April and May 2026. April and May each had only four reports, so we combine them and report no group smaller than five. Of our 24 active Leadership Experience Programme leaders, 19 have submitted at least one report, and 5 submitted a report in May or June 2026.
What we have seen in young people’s development
Across the indicators, leaders rate themselves highest on problem solving (an average of 3.63 out of 5) and on keeping their word (3.19). They rate themselves lowest on initiative (2.08). Our reading is that the young people we serve are good at working through a problem once it is in front of them and find it harder to start something nobody asked them to do.
The Tracer Study adds a longer view. Graduates rated leadership team development as their strongest area and wellbeing as their weakest. This suggests that young leaders may grow in how they lead others faster than in how they look after themselves.
The limits of what we can measure today
All of these measures rely on self-report. A rising LeaderMeter score may reflect real growth, growing confidence or simply familiarity with the form. The number of leaders reporting each month is small, and those who keep reporting are likely to be the most engaged. The averages for each indicator and the dashboard’s overall average of 2.67 for May 2026 are calculated on different bases from the monthly trend, so they should not be compared directly with the monthly trend. The Tracer Study did not record its number of respondents with its findings, and none of our measures yet includes a comparison group.
We have not found a perfect measure, and we doubt one exists. What we are building is a set of measures that check one another: monthly self-assessment, mentor review, follow-up after graduation and, through our second Tracer Study, evidence of what graduates actually do. We will keep publishing what we learn, including where our methods fall short.
Press and enquiries
Emmanuel Goodglory
Director, Research, Africa Impact & Global Visibility
The GracedLife Leadership Centre
egoodglory@gracedlifeleaders.org
General enquiries
TGLC Research Desk
research@gracedlifeleaders.org